How Can Geographic Information System (GIS) Dashboards Give Superintendents Real-Time Jobsite Visibility?
Table of Contents:

What Is a GIS Dashboard and Why Does It Matter for Construction Superintendents?
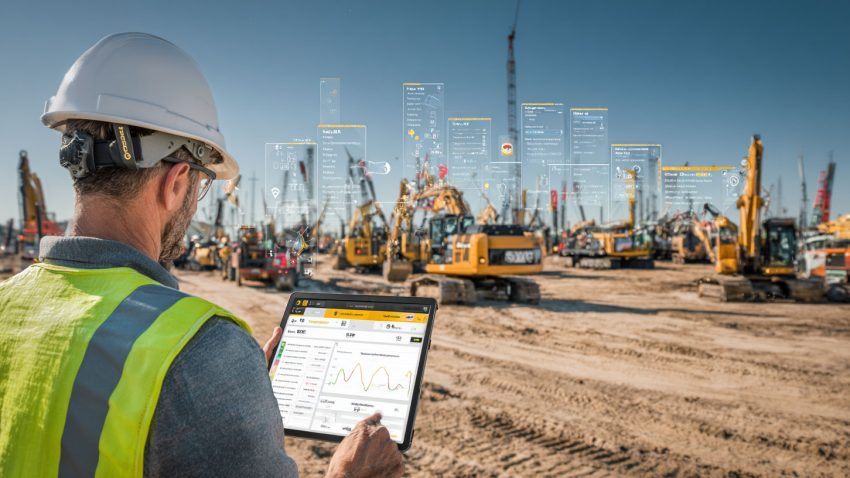
A Geographic Information System (GIS) dashboard is a real-time, map-based interface that allows construction superintendents to monitor all aspects of a jobsite through a single visual tool. Think of it as a command center that overlays critical field data—such as work zones, utility lines, delivery routes, staging areas, weather conditions, and inspection status—onto an interactive site map that updates live.
Unlike traditional paper plans or disconnected spreadsheets, GIS dashboards provide real-time spatial awareness. Superintendents can instantly see where trades are working, which zones are behind schedule, where equipment is staged, and whether restricted areas are properly marked. With one glance, field leaders can assess the health of the site and take action faster.
The power of a GIS dashboard lies in how it centralizes live jobsite intelligence. It pulls data from multiple sources—field updates, inspections, safety reports, delivery trackers—and visualizes them in context. This gives superintendents an edge in decision-making, especially on large-scale or phased projects where visibility is often limited and coordination challenges grow by the hour.
Top Benefits of GIS Dashboards in the Field
- Provides real-time spatial awareness of jobsite conditions
- Helps identify schedule, safety, or logistics issues instantly
- Enhances collaboration across field teams, PMs, and inspectors
- Centralizes field data in one user-friendly visual platform
Best Practices for Getting Started with GIS Dashboards
- Define key data layers (zones, deliveries, utilities, inspections)
- Assign dashboard access to all zone and trade leads
- Update layers daily with progress and field notes
- Train crews on how to interpret dashboard visuals during huddles
GIS dashboards turn site plans into real-time control panels—giving superintendents a clearer path to action every day.
How Do GIS Dashboards Improve Real-Time Decision-Making in the Field?
When you’re managing a complex jobsite, delays aren’t caused by lack of data—they’re caused by delays in seeing and understanding that data. GIS dashboards solve this by connecting progress, risk, and coordination updates to their physical locations on the map—so decisions can happen in the moment, not hours later.
Let’s say a delivery is delayed, an RFI is pending in a critical zone, or a crew is stacked in the wrong work area. If that info is buried in a spreadsheet or stuck in someone’s inbox, field teams won’t know until it’s too late. With a GIS dashboard, those updates are pinned directly to their zone, appear instantly on the site map, and alert the right people without delay.
Superintendents can use these dashboards to reassign crews, redirect traffic, hold quick huddles, or notify trade leads based on what’s actually happening—not just what was planned. This reduces downtime, improves communication, and keeps everyone aligned as field conditions shift throughout the day.
Top Benefits of Live Decision Support
- Speeds up responses to material delays, zone conflicts, or inspections
- Reduces field miscommunication and crew downtime
- Increases accountability by linking data to location
- Supports mobile-friendly decisions across site zones
Best Practices for Decision-Making with Dashboards
- Enable real-time field updates via mobile check-ins or QR codes
- Use alert flags for critical issues (RFIs, delays, incidents)
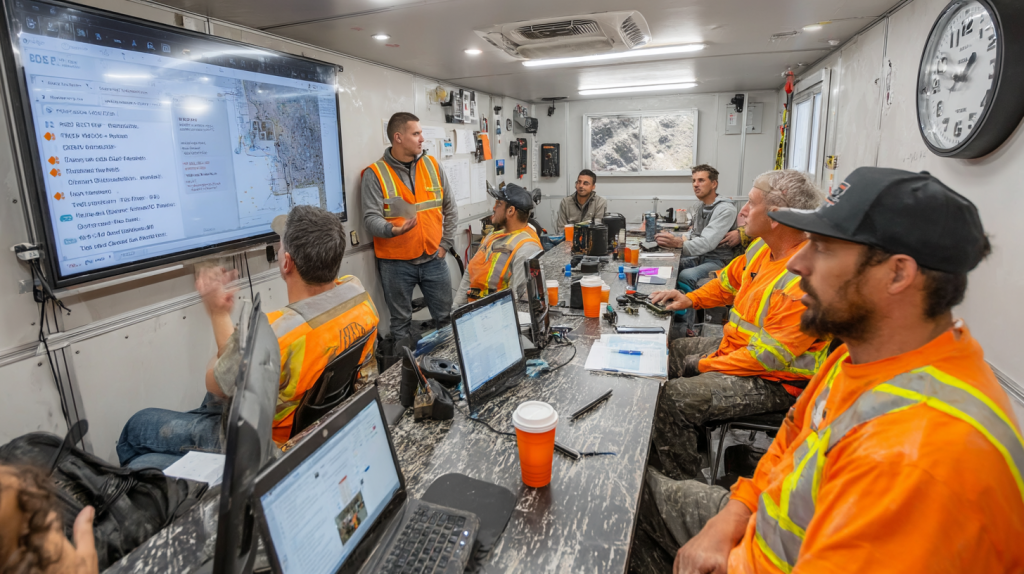
- Review dashboards during foreman meetings and shift changes
- Keep dashboard views simple—prioritize clarity over complexity
With GIS dashboards, superintendents don’t just manage—they lead with clarity, speed, and confidence.
Why Static Plans and Paper Logs Can’t Keep Up with Today’s Jobsite Demands
Construction jobsite complexity has outgrown paper. On fast-moving projects—especially those with phased turnover, multiple trades, and shifting access zones—static site plans and paper logs simply don’t provide the flexibility or visibility needed to coordinate in real time.
Paper can’t update when deliveries change, crews relocate, or a safety issue emerges. It can’t show live task progress, weather warnings, or inspection status across a dozen active work zones. And it definitely can’t give superintendents a mobile-friendly view of what’s happening across the site while they’re walking the field.
Static methods lead to outdated information, repeated work, and miscommunication between teams. This slows productivity, increases risk, and costs the project valuable time. Even PDF markups or whiteboards can’t match the speed and clarity that today’s field conditions demand.
GIS dashboards solve this by giving teams a living site map—one that updates automatically as conditions change. They make information accessible, visual, and actionable, so decisions can be made with confidence and coordination stays tight.
Top Benefits of Replacing Static Tools with Dashboards
- Eliminates delays from outdated or inaccessible field data
- Keeps all field teams working from the same live site map
- Improves handoffs between shifts, trades, and inspectors
- Increases transparency for owners, PMs, and consultants
Best Practices for Phasing Out Paper
- Start with one GIS layer: site layout or delivery routes
- Transition shift reports and punch items into visual tracking
- Train foremen to log field notes using mobile GIS tools
- Review dashboard data weekly to reinforce adoption
Static tools worked for static jobs. But modern builds demand living, breathing, real-time maps—and GIS dashboards deliver exactly that.

StruxHub: Revolutionizing Project Management in Large Commercial Construction
How GIS Dashboards Help Manage Trade Stacking and Zone Conflicts
One of the most common problems on a construction site—especially large or fast-moving ones—is trade stacking. When multiple crews overlap in the same area, productivity drops, safety risks rise, and coordination headaches multiply. GIS dashboards help superintendents prevent this by providing a clear, live view of who’s working where, and when.
With a well-structured dashboard, work zones are color-coded and linked to daily crew assignments. If two trades are scheduled to occupy the same space, the conflict is visible immediately—before it becomes a problem in the field. Superintendents can then reassign zones, re-sequence work, or stagger shifts to reduce congestion.
This spatial awareness also improves communication. Instead of relying on verbal updates or last-minute changes, teams can see the plan—and the reality—on a shared screen. Trade leads can check whether an area is ready before mobilizing, and foremen can verify that materials and access routes are available before work begins.
Over time, this approach reduces clashes, improves task flow, and strengthens field coordination.
Top Benefits for Zone-Level Coordination
- Prevents trade stacking and crowding in tight workspaces
- Increases productivity by organizing zone access by task
- Supports faster daily planning and clearer shift transitions
- Helps trades trust the plan—and stick to it
Best Practices for Managing Zone Assignments
- Use a daily color-coded zone overlay for each trade scope
- Review zone conflicts during pre-task or huddle meetings
- Link materials and equipment deliveries to specific zones
- Track crew movement to identify chronic overlap issues
When every team can see the map—and their role in it—site coordination becomes proactive, not reactive.
Related Articles:
Best Guide to AI in Construction Project Management: How Smart Tools Are Improving Construction Site Productivity; AI
Best Guide to Geographic Information Systems (GIS) in Construction: How Location-Based Data Improves Construction Project Management
Best Guide to Smart Helmets in Construction: Enhancing Safety, Communication, and Site Efficiency
Best Construction Scheduling Software for General Contractors and Superintendents
Best Guide to Solar Farm Construction Management: Top Solar Construction Management Software for Tracking Projects, Deliveries, and Compliance
Why GIS Dashboards Are Game-Changing for Inspections and Punch Lists
Inspection delays and punch list bottlenecks are some of the biggest causes of friction at the end of a build. GIS dashboards help eliminate those delays by linking inspection requirements and outstanding punch items directly to their location on the jobsite map—creating a real-time quality control view that evolves with the project.
Each item can be marked by zone, task, or trade, with photos, status updates, and due dates attached. This helps inspectors know exactly what’s ready, what needs attention, and what’s been closed out. Superintendents can see where crews are falling behind on fixes, or where inspection routes need to be reprioritized based on zone readiness.
This spatial clarity speeds up closeout. Instead of flipping through spreadsheets or disconnected apps, teams work from a single dashboard that shows the live status of quality and compliance—reducing back-and-forth, improving accuracy, and keeping everything moving toward turnover.
Top Benefits for QA/QC and Closeout
- Improves inspection efficiency with map-based tracking
- Reduces punch list confusion by tying items to exact locations
- Speeds up turnover readiness through better visual coordination
- Builds a record of field quality that’s easy to audit and share
Best Practices for Inspection Visibility
- Create a dashboard layer for inspection checklists and status
- Pin punch items directly to the affected zone or area
- Use photo uploads and notes for faster issue verification
- Include inspection data in turnover planning and owner meetings
When quality and compliance are visual, they’re easier to manage—and harder to ignore.
How GIS Dashboards Boost Communication Across Field and Office Teams
Clear communication between the field and the office is essential, but it often breaks down due to lag, overload, or unclear documentation. GIS dashboards help bridge that gap by turning jobsite updates into shared visuals that both field teams and PMs can interpret instantly.
Instead of relying on texts, emails, or daily reports, superintendents can update progress, flag issues, and share coordination notes directly on the map. Project managers and owner reps can check dashboard status from the office—or from another state—and see exactly what’s happening, zone by zone.
This improves transparency and trust. The field doesn’t feel micromanaged. The office doesn’t feel out of the loop. And when decisions need to be made—whether it’s approving a change order or rerouting a delivery—both sides can do it faster and with more confidence.
Top Benefits of Better Field–Office Visibility
- Reduces miscommunication and backtracking
- Speeds up decision-making across teams and locations
- Supports better forecasting and reporting for PMs
- Builds a real-time record of project progress and changes
Best Practices for Communication via Dashboard
- Assign specific update responsibilities to field leads
- Use shared filters for office views (e.g., zone readiness, RFIs)
- Include dashboard summaries in OAC and status meetings
- Track and log major changes visually for team alignment
When everyone’s looking at the same map—whether they’re onsite or remote—the job gets done faster, cleaner, and with fewer surprises.
How StruxHub Works Alongside GIS Dashboards for Field Coordination
While GIS dashboards give superintendents real-time visibility, StruxHub turns that visibility into coordinated action. It’s not about choosing one or the other—it’s about using both together to manage complex jobsite workflows.
StruxHub integrates task assignments, punch items, RFIs, deliveries, and zone scheduling into one connected platform. When a superintendent spots an issue on a GIS dashboard—like a blocked staging zone or an unfinished inspection—StruxHub allows them to assign that task, notify the right trade, and track the fix in real time.
This ensures field updates don’t just sit on a map—they turn into action items that get completed on schedule. Crews get the right instructions, PMs get the right documentation, and nothing falls through the cracks.
GIS dashboards show what’s happening. StruxHub helps control what happens next.
Together, they give field leaders the tools to see more, respond faster, and keep the build moving forward without missing a beat.

StruxHub
Experience the power of StruxHub today and witness firsthand how it can revolutionize your construction operations.
FAQ
What is a GIS dashboard and how is it used on a construction site?
A GIS (Geographic Information System) dashboard is an interactive, map-based platform that displays live jobsite data layered over a site layout or geospatial map. It gives superintendents, project managers, and trade leads a real-time view of critical site information—like task progress, delivery status, crew locations, inspection zones, and safety alerts.
On a construction site, GIS dashboards are used to visually manage field operations. For example, if a superintendent wants to check which zones are ready for inspection, they can view color-coded areas on the dashboard. If there’s a delivery scheduled for a congested area, they can reroute it to avoid stacking trades.
GIS dashboards are especially helpful for phased or large-scale projects where visibility across zones is difficult. They reduce miscommunication, speed up decision-making, and help crews stay focused on the right tasks in the right place—every shift.
By replacing static plans and scattered spreadsheets with real-time spatial intelligence, GIS dashboards help construction teams operate more efficiently, safely, and collaboratively.
How do GIS dashboards differ from regular project management tools?
Traditional project management tools focus on schedules, documents, and communication. They show what needs to happen and when. GIS dashboards add the where—by linking tasks, updates, and field conditions directly to locations on a jobsite map.
This spatial element transforms how teams coordinate. Instead of searching through reports to understand an issue, field leaders can look at the map and instantly see what’s happening where. This helps identify conflicts, delays, or risks before they affect the schedule.
Another key difference is accessibility. GIS dashboards are often mobile-friendly and can be updated live from the field. This gives superintendents and foremen better visibility without waiting on office updates or chasing down information.
GIS dashboards don’t replace your PM tools—they enhance them by bringing your schedule and field conditions into one shared visual experience.
Can GIS dashboards help with punch lists and inspections?
Yes—GIS dashboards are extremely effective for managing punch lists, inspections, and quality assurance processes. Instead of keeping these tasks in disconnected spreadsheets or apps, each punch item or inspection requirement is pinned to its exact location on the jobsite map.
Superintendents and inspectors can see what’s outstanding in each zone, what’s been signed off, and what’s ready for review. They can attach notes, upload photos, and log issue resolutions directly through the dashboard—creating a searchable, visual QA/QC record.
This visual tracking makes it easier to prioritize tasks, delegate work, and accelerate closeout. It also improves transparency during walkthroughs with owners or consultants, since everyone can see what’s complete and what still needs attention.
GIS dashboards make quality management more proactive, more organized, and far less chaotic.
How do GIS dashboards improve communication between the field and office?
Field–office communication often breaks down due to lag, unclear updates, or conflicting information. GIS dashboards help fix this by turning jobsite updates into visual, real-time data that both field teams and office staff can understand instantly.
Superintendents can update task status, mark zones as ready, or flag issues directly on the map. Project managers and owner reps—whether onsite or remote—can check the dashboard and see exactly what’s happening without waiting for a phone call or email.
This improves alignment across daily coordination, OAC meetings, and milestone tracking. Everyone stays on the same page, decisions happen faster, and fewer things slip through the cracks.
GIS dashboards reduce the distance between trailer and field—and between site and office—by keeping everyone looking at the same real-time map.
What skills or tools are needed to use GIS dashboards effectively?
You don’t need to be a GIS expert to benefit from GIS dashboards in construction. Most systems used on jobsites today are user-friendly, mobile-compatible, and designed with field teams in mind.
Key skills that help include:
- Basic map navigation and spatial awareness
- Understanding of jobsite zoning and task sequencing
- Familiarity with field reporting and daily updates
- Willingness to use mobile tools or tablets on site
The tools themselves range from commercial platforms like ArcGIS, SiteAware, or DroneDeploy, to custom dashboards integrated with field apps. Many dashboards can be customized to fit your team’s needs—tracking deliveries, inspections, safety metrics, or zone readiness in a single interface.
The most important factor isn’t technical skill—it’s adoption. The more your team uses GIS dashboards for daily coordination, the more value they’ll bring to the project.

StruxHub
Discover how StruxHub can revolutionize your construction management. Contact us today!
Pillar Articles Links:
Best Guide to Construction Logistics Plans (CLPs): What Owners Want to See Before Work Starts
Best Construction Scheduling Software for General Contractors and Superintendents