How Superintendents Use Construction Logistics Plan (CLP) Dashboards to Track Deliveries, Equipment, and Crew Activity
Table of Contents:

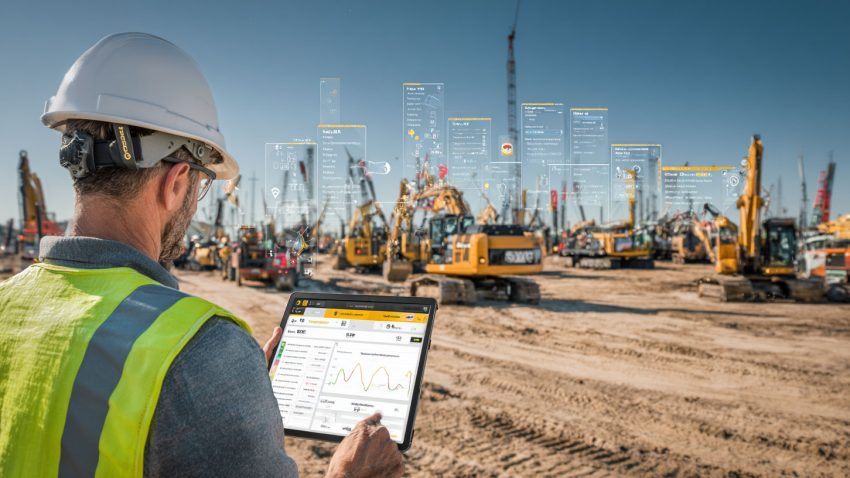
For today’s superintendents, jobsite logistics has become a data challenge as much as a coordination one. Between material deliveries, heavy equipment movement, and rotating crews, keeping every element aligned in real time is nearly impossible with paper logs or static spreadsheets. That’s why Construction Logistics Plan (CLP) dashboards are transforming the way field teams manage daily operations.
A CLP dashboard provides a live window into all logistics activity across the site—showing what deliveries are scheduled, where equipment is located, and which crews are working in specific zones. It connects data from gate scheduling, procurement, and workforce tracking systems into one visual interface. Instead of juggling calls, texts, and clipboards, superintendents can view a dynamic overview that updates automatically as field conditions change.
In this article, we’ll explore how CLP dashboards empower construction leaders to streamline scheduling, prevent bottlenecks, and improve accountability. You’ll also learn how platforms like StruxHub Construction Management Software integrate AI and real-time field inputs to give supers complete control over the movement of materials, machinery, and manpower on every project.
Centralizing Deliveries in One Real-Time View
Material deliveries can make or break daily productivity. When multiple suppliers arrive simultaneously or without notice, gate congestion can delay entire workflows. CLP dashboards solve this by consolidating all delivery bookings, arrival times, and unloading locations into one synchronized schedule.
Superintendents use the dashboard to see exactly what’s coming to the site and when, adjusting times or routes on the fly if conflicts appear. Notifications alert crews when a delivery is on its way, ensuring laydown areas and labor are ready. By turning logistics into a real-time system, dashboards eliminate guesswork and keep deliveries flowing without interruption.
H3 Top Benefits
- Provides instant visibility of daily and upcoming deliveries
- Prevents gate congestion with automated scheduling alerts
- Improves coordination between suppliers and field crews
H3 Best Practices
- Require subcontractors to reserve time slots through the dashboard
- Review daily delivery logs each morning and end-of-day
- Integrate GPS tracking for accurate ETA updates
H3 Q&A Mini-FAQ
Q: How do dashboards improve delivery efficiency?
A: They centralize booking and automate notifications, keeping trucks and crews aligned in real time.
Q: Can delivery data feed project reports automatically?
A: Yes—platforms like StruxHub generate delivery summaries that sync directly to project records.
Q: Do CLP dashboards handle multiple gates or sites?
A: Absolutely—each gate can be monitored separately within a unified interface.
Related Links
- Related: Why Construction Superintendents Are Turning to Geographic Information Systems (GIS) for Smarter Field Operations
- Related: Best Guide to Geographic Information Systems (GIS) in Construction: How Location-Based Data Improves Construction Project Management
- Product Link: StruxHub Delivery Management Dashboard
A real-time delivery dashboard transforms logistics from reactive coordination to proactive control—helping superintendents maintain pace and predictability even on the busiest sites.

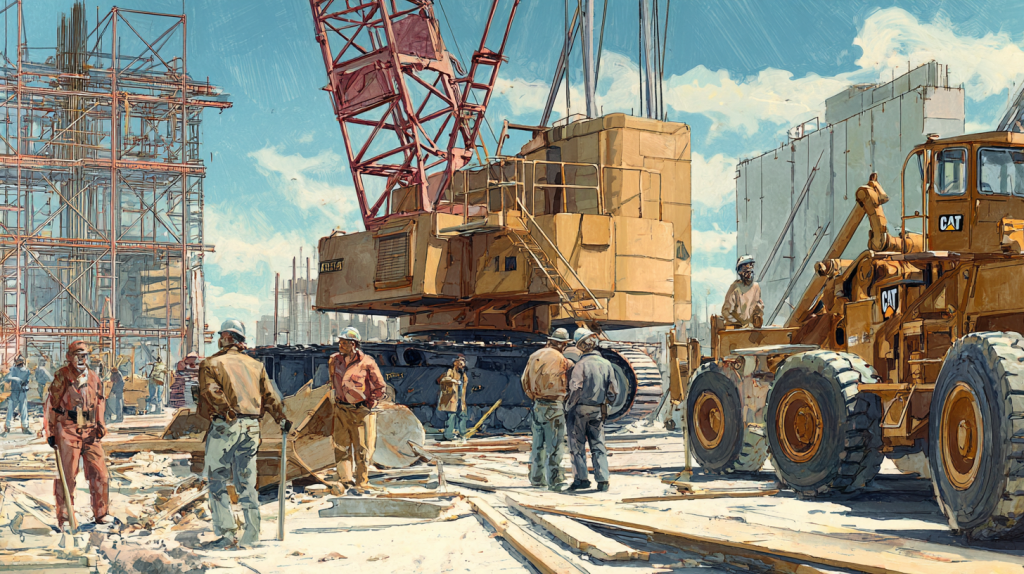
Tracking Equipment Movement and Utilization
Heavy equipment is one of a superintendent’s most valuable—and costly—resources. Misplaced machinery, idle time, or overlapping crane paths can drain budgets and create hazards. CLP dashboards integrate equipment tracking data using GPS sensors and geofencing, providing visibility into where each asset is and how it’s being used.
Superintendents can assign equipment to zones, monitor operating hours, and verify utilization rates directly from the dashboard. Automated alerts notify teams when machines move outside designated areas or exceed idle thresholds. For owners, this transparency improves asset management and ensures equipment investments are being used efficiently.
H3 Top Benefits
- Tracks real-time location and usage of all major equipment
- Reduces downtime through optimized resource allocation
- Improves safety by preventing unplanned equipment overlaps
H3 Best Practices
- Tag each piece of equipment with GPS or RFID sensors
- Set idle-time thresholds and review weekly utilization reports
- Integrate maintenance schedules to avoid unexpected breakdowns
H3 Q&A Mini-FAQ
Q: Can dashboards track equipment across multiple phases?
A: Yes—equipment assignments can shift automatically as project zones evolve.
Q: How does tracking improve project efficiency?
A: It ensures the right equipment is available when needed and not sitting unused.
Q: Can StruxHub integrate with telematics systems?
A: Absolutely—StruxHub connects directly with leading fleet-tracking tools for seamless data updates.
Related Links
- Related: How Construction Command Centers Help GCs Centralize Field Data and Crew Coordination
- Related: Best Guide to Creating a Construction Site Utilization Plan with GIS Mapping, AI, and Logistics Tools
- Product Link: How AI Tools Are Transforming Construction Logistics Plans (CLPs) for Scheduling, Deliveries, and Field Coordination
Equipment visibility keeps field operations lean, safe, and cost-effective—ensuring every machine contributes measurable value to daily progress.

Monitoring Crew Activity and Resource Allocation
In high-volume projects, knowing where your crews are and what they’re doing at any moment is vital for coordination. CLP dashboards merge labor tracking with logistics planning, showing superintendents which trades are active in each zone and how crew distribution aligns with the project schedule.
Real-time updates from digital daily reports feed directly into the dashboard, giving supers a clear view of manpower trends and potential bottlenecks. If one trade finishes early or another falls behind, adjustments can be made immediately. This integration helps balance workloads and keeps productivity steady across all teams.
H3 Top Benefits
- Displays live manpower data by trade and location
- Identifies under- or over-staffed zones quickly
- Aligns labor allocation with material and equipment readiness
H3 Best Practices
- Sync daily crew reports automatically to the logistics dashboard
- Hold morning coordination meetings using live dashboard data
- Use analytics to forecast manpower needs for upcoming phases
H3 Q&A Mini-FAQ
Q: How do CLP dashboards track crew activity?
A: They pull data from digital daily reports and time-tracking apps to show who’s working where.
Q: Can labor data be linked to productivity metrics?
A: Yes—StruxHub analytics correlate manpower, material usage, and schedule progress in one view.
Q: Do dashboards replace attendance logs?
A: They complement them by visualizing real-time crew locations and resource deployment.
Related Links
- Related: Best Construction Logistics Plan (CLP) Practices to Get Owner Approval and Pass Permit Reviews
- Related: How AI Tools Are Transforming Construction Logistics Plans (CLPs) for Scheduling, Deliveries, and Field Coordination
- Related: Best Guide to Construction Logistics Plans (CLPs): What Owners Want to See Before Work Starts
With integrated crew tracking, CLP dashboards help superintendents see the complete jobsite picture—connecting manpower, materials, and machinery into one synchronized workflow.
StruxHub: Revolutionizing Project Management in Large Commercial Construction
Integrating Dashboards with Scheduling and Project Timelines
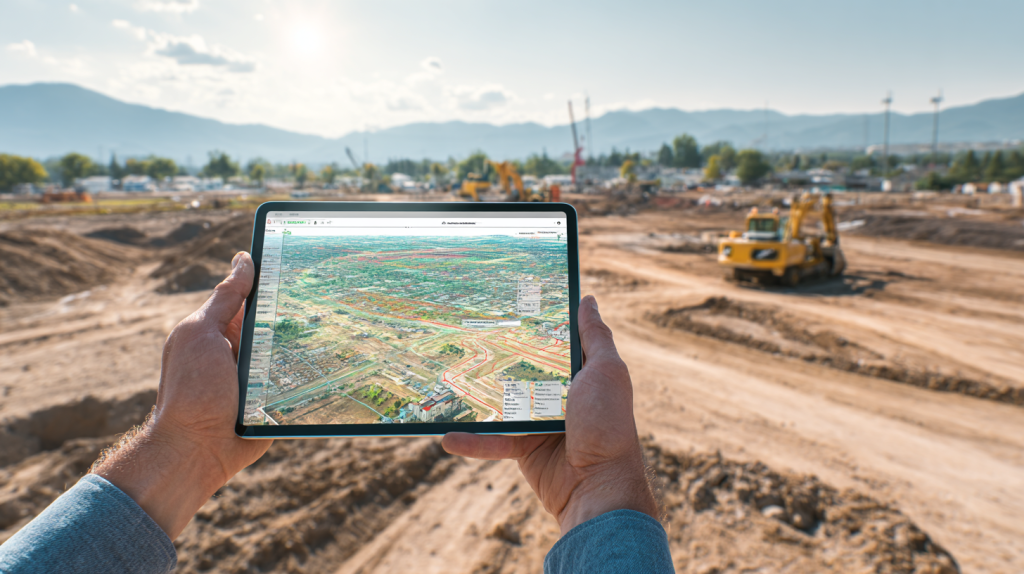
A logistics dashboard becomes truly powerful when it connects directly to the project schedule. By integrating CLP dashboards with scheduling tools, superintendents can see how daily logistics decisions affect long-term milestones. If a delivery is delayed or a crane is overbooked, the dashboard automatically flags the impact on schedule progress, allowing teams to react immediately instead of days later.
These integrations also eliminate redundant data entry. Delivery times, crew assignments, and material usage automatically sync with Gantt charts or project management systems. For owners, this creates a continuous thread of accountability—showing exactly how logistical coordination drives productivity.
H3 Top Benefits
- Links daily logistics data directly to schedule performance
- Provides early visibility into schedule risks and potential delays
- Reduces manual updates between field and office systems
H3 Best Practices
- Sync dashboards with scheduling tools like Primavera or Procore
- Set automated alerts when logistics changes affect key milestones
- Review live dashboards during weekly coordination meetings
H3 Q&A Mini-FAQ
Q: How does integration improve project control?
A: It connects daily activities with schedule milestones, giving teams immediate feedback on progress.
Q: Can StruxHub link logistics dashboards to schedules?
A: Yes—it automatically updates schedules based on real-time delivery and labor data.
Q: Does this integration reduce paperwork?
A: Significantly—updates happen automatically, minimizing duplicate data entry.
Related Links
- Related: Top 6 Ways Superintendents and General Contractors Use Geographic Information Systems (GIS) for Site Operation Planning and Scheduling Coordination
- Related: Everything Superintendents and Contractors Need to Know About GIS Site Utilization Planning for Large Construction Projects
- Product Link: StruxHub Scheduling and Logistics Dashboard
When schedules and dashboards operate as one system, every logistics decision becomes traceable, measurable, and easier to align with long-term project goals.
Using Dashboards to Enhance Safety and Compliance
Jobsite logistics isn’t just about moving materials—it’s also about protecting workers. CLP dashboards now include safety overlays that show pedestrian routes, crane paths, and restricted areas in real time. When a delivery truck enters a designated zone or a piece of equipment crosses a safety perimeter, alerts notify the superintendent immediately.
These dashboards also store historical safety data, allowing teams to identify recurring issues or high-risk areas. By visualizing safety alongside logistics, superintendents can take proactive action before an incident occurs. For owners, this integration demonstrates compliance and provides verifiable digital records during audits.
H3 Top Benefits
- Monitors live safety zones and traffic routes in real time
- Sends alerts when vehicles or equipment enter restricted areas
- Documents compliance data for audits and insurance reviews
H3 Best Practices
- Overlay logistics data with safety zones on CLP dashboards
- Review alerts and incident logs daily during toolbox talks
- Use dashboard heatmaps to identify high-risk zones
H3 Q&A Mini-FAQ
Q: How do dashboards improve jobsite safety?
A: They provide visual tracking of safe zones, equipment paths, and worker movement patterns.
Q: Can safety data be linked to logistics updates?
A: Yes—StruxHub automatically logs activity within defined safety zones for full visibility.
Q: Are safety dashboards customizable?
A: Absolutely—superintendents can define zones, routes, and alert thresholds based on site conditions.
Related Links
- Related: Best Guide to Smart Helmets in Construction: Enhancing Safety, Communication, and Site Efficiency
- Related: Best Guide to Construction Risk Management: How Top Contractors Control Jobsite Risk
- Related: Solar Construction Jobs Are Booming in the USA… But Where Are the Workers?
Integrating safety data into logistics dashboards allows teams to maintain both efficiency and accountability—making every movement on site safer and more deliberate.
StruxHub
Experience the power of StruxHub today and witness firsthand how it can revolutionize your construction operations.
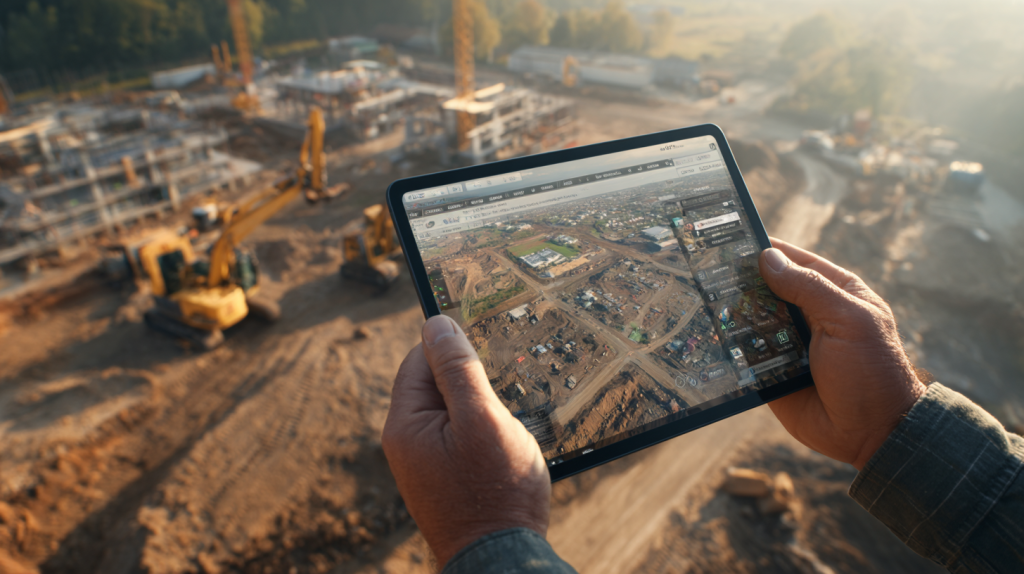
Turning Jobsite Data into Actionable Insights
Raw data means little without interpretation. The true value of CLP dashboards lies in their ability to convert jobsite information into meaningful insights. Through automated analytics and reporting, superintendents can identify recurring delivery delays, underutilized equipment, or manpower inefficiencies. These insights fuel better forecasting and smarter decision-making.
Owners and executives benefit, too. Dashboards can generate summarized performance reports showing how logistics efficiency translates into schedule progress and cost control. When logistics, field activity, and safety data all feed one system, the entire project becomes easier to manage—and easier to optimize.
H3 Top Benefits
- Provides clear analytics for productivity and logistics performance
- Highlights patterns and recurring bottlenecks
- Supports continuous improvement through measurable KPIs
H3 Best Practices
- Review analytics reports weekly with project teams
- Track leading indicators such as idle time, delivery punctuality, and crew balance
- Use dashboard data to adjust procurement and scheduling strategies
H3 Q&A Mini-FAQ
Q: How does dashboard data improve decision-making?
A: It reveals hidden inefficiencies, allowing supers to make data-backed adjustments.
Q: Can analytics help forecast future resource needs?
A: Yes—StruxHub’s predictive insights estimate future manpower, equipment, and material demand.
Q: Do owners use these insights too?
A: Definitely—they rely on dashboards to validate progress, performance, and cost efficiency.
Related Links
- Related: How Robotics and AI Are Transforming Large-Scale Solar Farm Construction with Automation and Smart Project Management
- Related: Best Guide to Solar Farm Construction Management: Top Solar Construction Management Software for Tracking Projects, Deliveries, and Compliance
- Product Link: StruxHub Analytics and Performance Dashboard
By transforming raw logistics data into clear insights, dashboards empower teams to make faster, smarter decisions—turning information into a competitive advantage on every project.
How StruxHub Helps Superintendents Manage Deliveries, Equipment, and Crews in One Dashboard
StruxHub was designed to bring all construction logistics data into a single, intelligent dashboard. With real-time visibility, predictive analytics, and integrated scheduling tools, it gives superintendents complete control over daily operations—no spreadsheets, gate logs, or manual coordination needed.
Deliveries can be booked digitally, tracked live, and automatically synced to project schedules. Equipment tracking integrates via GPS, while crew data flows in from daily reports. Safety zones, access routes, and scheduling changes appear instantly across all devices. For owners, this transparency builds trust, ensuring every logistical detail is documented and optimized.
StruxHub’s all-in-one dashboard doesn’t just show what’s happening—it helps you predict what’s coming next, keeping the jobsite running efficiently and safely every day.
H3 Top Benefits
- Combines logistics, equipment, and crew data in one visual dashboard
- Automates scheduling and communication between trades and suppliers
- Predicts bottlenecks before they disrupt workflow
H3 Best Practices
- Customize dashboards for different project phases or site types
- Review key analytics with teams during morning coordination huddles
- Use mobile access to update logistics data directly from the field
H3 Q&A Mini-FAQ
Q: How does StruxHub simplify superintendent reporting?
A: It consolidates all field data into one system, eliminating multiple spreadsheets and emails.
Q: Can dashboards be shared with owners and clients?
A: Yes—StruxHub allows controlled sharing for transparency and progress reporting.
Q: How does AI enhance StruxHub dashboards?
A: AI analyzes trends and predicts scheduling or logistics conflicts before they occur.
Related Links
- Related: Best Guide to Construction Field Management Software: How to Choose the Right Construction Site Operations Solutions
- Related: Best Construction Field Management Software: How to Choose the Top Construction Field Management Software for 2025
- Related: Best Construction Field Management Software for Contractors and Superintendents: Top 10 Features and Benefits to Improve Efficiency Today
With StruxHub’s dashboards, superintendents gain more than visibility—they gain foresight, efficiency, and confidence that every part of the jobsite is working in sync.

FAQ
What is a Construction Logistics Plan (CLP) dashboard?
A CLP dashboard is a centralized digital interface that tracks and manages all logistics activity on a construction site, including deliveries, equipment, and crew movement. It consolidates data from multiple systems—scheduling, procurement, and safety—into a real-time visual map. For superintendents, it serves as the ultimate command center for daily coordination.
Why are dashboards becoming essential tools for superintendents?
Construction projects are more complex than ever, with dozens of trades, hundreds of deliveries, and tight urban restrictions. Dashboards simplify this complexity by visualizing logistics in one place, reducing communication breakdowns and eliminating manual coordination. They save time, improve accountability, and provide instant insights that help projects stay on schedule.
Can dashboards integrate with existing scheduling and reporting tools?
Yes. Platforms like StruxHub are built to integrate seamlessly with popular scheduling tools (Primavera, Procore, Autodesk Build) and reporting systems. This integration keeps all stakeholders aligned and ensures that updates flow automatically from field to office—without redundant entry or delays.
How do logistics dashboards improve site safety?
By combining logistics and safety data, dashboards make hazards visible before they occur. They map delivery routes, equipment zones, and pedestrian areas, and send alerts when unsafe conditions appear. This proactive awareness minimizes accidents and strengthens compliance with safety standards.
How does StruxHub’s dashboard differ from other platforms?
StruxHub’s CLP dashboards are built specifically for construction logistics—not just project management. They combine real-time scheduling, delivery coordination, equipment tracking, and crew analytics in one unified system. With AI-powered insights and full mobile access, StruxHub helps superintendents turn complex logistics into efficient, transparent, and measurable daily operations.

StruxHub
Discover how StruxHub can revolutionize your construction management. Contact us today!
Related Pillar Articles:
Best Guide to Construction Logistics Plans (CLPs): What Owners Want to See Before Work Starts