Best Guide to Geographic Information Systems (GIS) in Construction: How Location-Based Data Improves Construction Project Management
Table of Contents:
What Is a Geographic Information System (GIS) and How Is It Used in Construction?
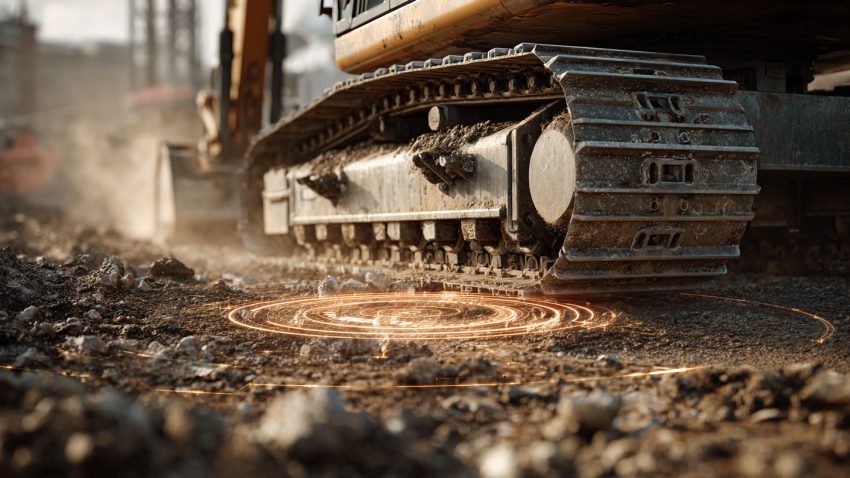
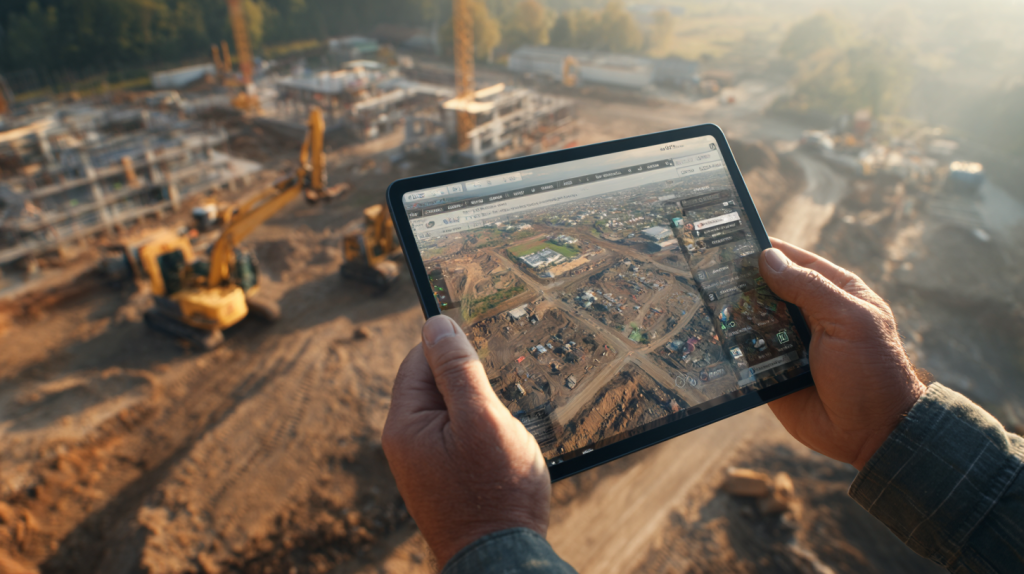
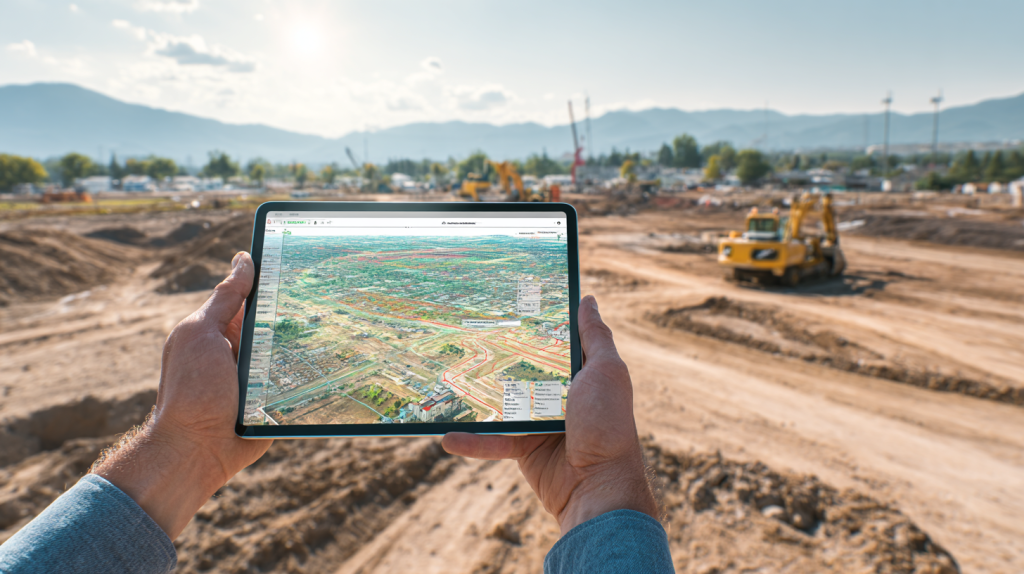
A Geographic Information System (GIS) is a digital platform used to capture, store, analyze, and visualize location-based data. In construction, GIS is increasingly being used to overlay jobsite information onto real-world maps—allowing teams to make more informed decisions about site layout, utilities, scheduling, and environmental conditions. From planning stages to final project handover, GIS tools bring context to data, helping construction leaders manage space, resources, and risks with greater precision.
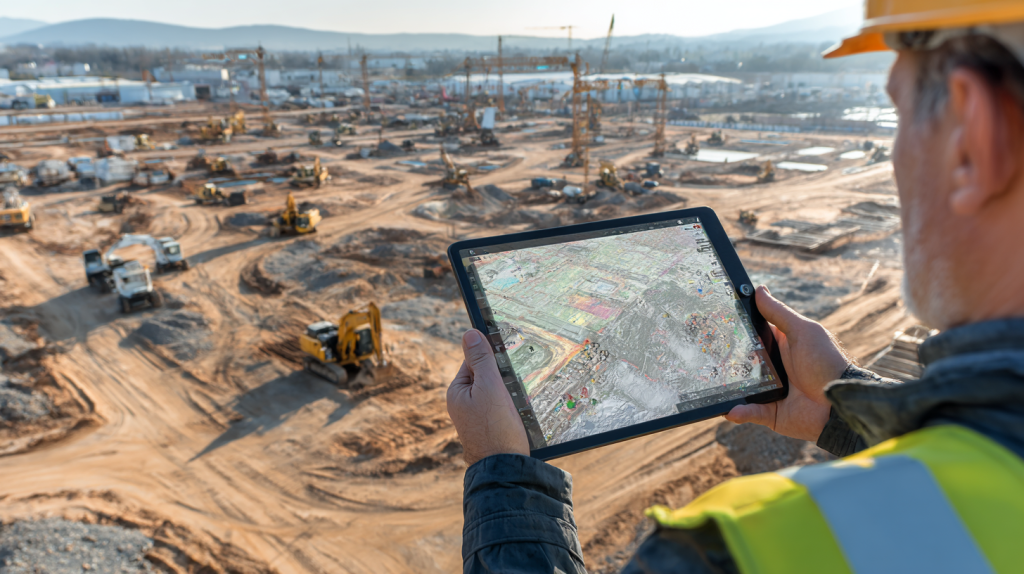
Unlike traditional maps or static PDF plans, GIS provides interactive layers of data that can include property boundaries, zoning regulations, underground infrastructure, terrain elevation, or even weather impacts. Contractors and superintendents use GIS to view and share this data across teams in real time, eliminating the guesswork that often comes with fragmented project documentation. It also enables more proactive planning—teams can assess jobsite constraints, identify access points, and optimize resource allocation well before breaking ground.
GIS doesn’t replace CAD or BIM—it enhances them. While CAD focuses on design and BIM on model-based workflows, GIS connects those designs to the real-world environment. This makes GIS a powerful tool for bridging the gap between planning and execution, especially on large or complex projects where spatial context matters.
Top Features of GIS in Construction Applications
- Layered maps combining terrain, zoning, utility, and environmental data
- Real-time map visualization for mobile or web-based access
- Integration with GPS, drones, and IoT sensors for spatial accuracy
- Tools for marking, annotating, and measuring distances across the site
Top Benefits for Project Teams
- Improves planning accuracy with spatial data overlays
- Helps reduce field conflicts by visualizing infrastructure before digging
- Enhances collaboration with shared geospatial views
- Accelerates site assessments and feasibility studies
Best Practices for Using GIS Effectively in Construction
- Import reliable base maps and up-to-date zoning layers
- Train teams on how to toggle data layers for quick field assessments
- Use GIS early in preconstruction to optimize site layout and access
- Incorporate GIS maps into RFIs, submittals, and owner presentations
GIS gives construction professionals a smarter way to view, share, and act on location-specific data—turning traditional site maps into dynamic decision-making tools.
Why Superintendents and Jobsite Managers Use GIS for Field Operations
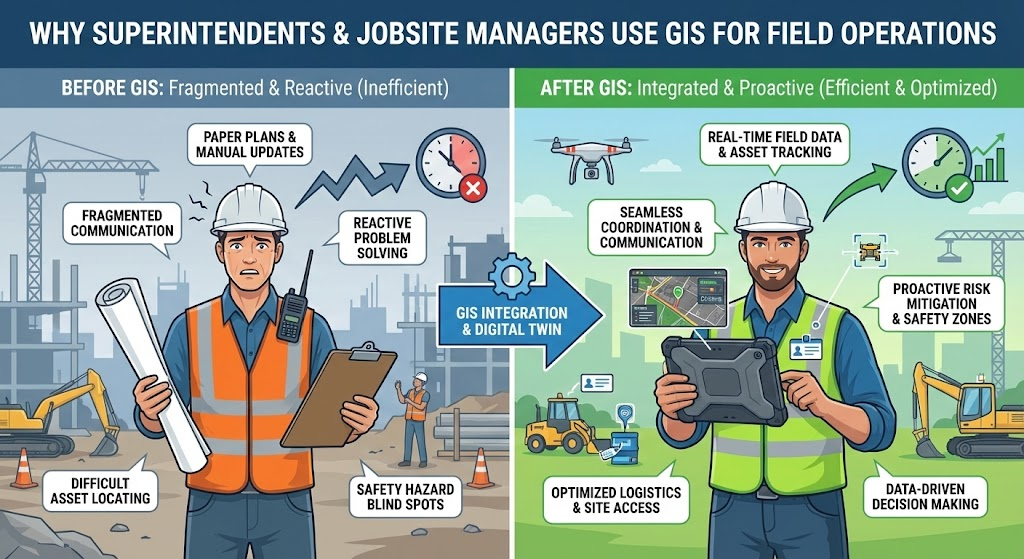
Superintendents and jobsite managers are constantly making decisions based on space, sequence, and safety. GIS gives them a toolset to manage these challenges with greater confidence. Instead of relying on static plans or verbal instructions, GIS provides interactive site maps with up-to-date data—making it easier to coordinate crews, track progress, and avoid costly errors.
For field leaders, GIS means seeing the full picture. Whether it’s locating underground utilities, adjusting staging areas, or rerouting access paths during active construction, GIS allows superintendents to respond faster and with more certainty. It’s not just about viewing data—it’s about interacting with it in a way that supports decision-making in real time.
GIS also improves communication between the field and the office. When a superintendent uses GIS to flag a risk, annotate a work zone, or mark material storage areas, that information is immediately available to project managers, trade partners, and inspectors. This shared visibility helps reduce miscommunication and ensures everyone is aligned on where work is happening and what’s changing on the ground.
Top Features That Support Field Operations
- Interactive field maps viewable on mobile devices and tablets
- Tools for tagging, drawing, and labeling work zones or hazards
- Real-time location tracking for equipment or deliveries
- Ability to create and share georeferenced reports from the field
Top Benefits for Superintendents and Field Leaders
- Faster decision-making through visual field data
- Reduces layout errors and spatial conflicts between trades
- Enhances crew safety with accurate hazard mapping
- Improves coordination with office staff and subcontractors
Best Practices for Implementing GIS on the Jobsite
- Equip field teams with tablets or mobile access to GIS maps
- Use GPS tagging to monitor and track equipment or zones
- Encourage superintendents to use GIS annotations for RFIs or updates
- Review GIS layers during daily huddles to align field activity
GIS helps field teams turn location awareness into action—keeping everyone aligned and improving the speed and quality of onsite decision-making.
Understanding GIS Data Types and Geodatabases for Construction Projects
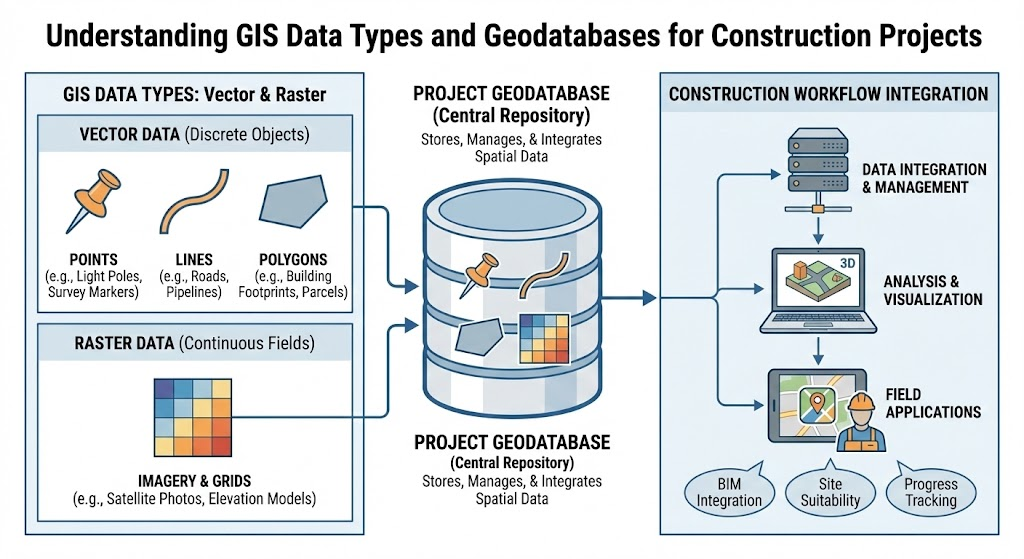
To get the most out of GIS in construction, it’s important to understand the types of data it handles and how that data is organized. GIS isn’t just a visual tool—it’s a structured system built on geodatabases that hold different layers of spatial and non-spatial information. When used correctly, this data structure allows for precise planning, real-time updates, and deep analytics that support complex project workflows.
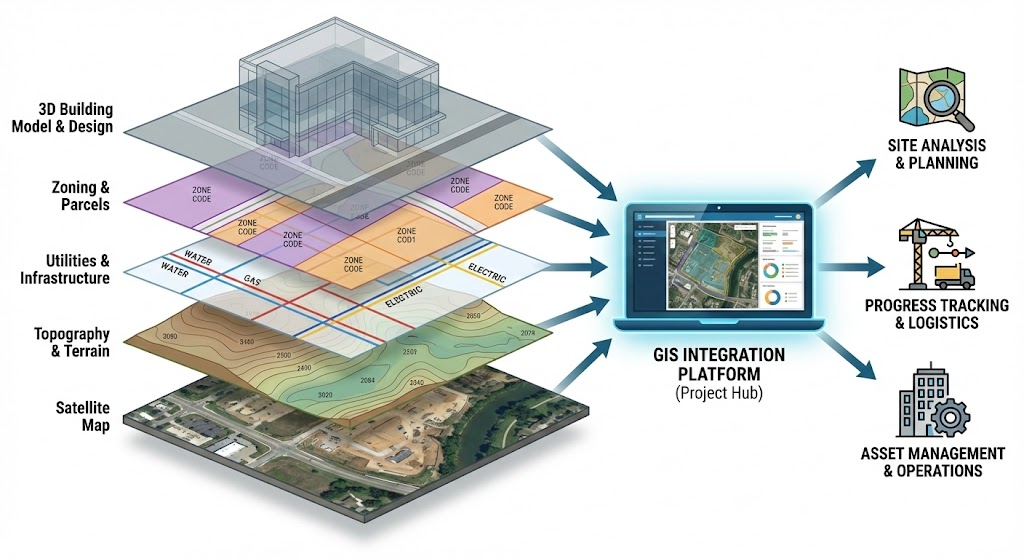
GIS data typically falls into two main categories: vector and raster. Vector data includes points (like equipment locations), lines (such as utility paths), and polygons (like property boundaries or staging areas). Raster data includes satellite imagery, elevation models, or heatmaps of environmental factors like noise or soil composition. These data types are stored in a geodatabase, which allows teams to layer, query, and update them efficiently across the project lifecycle.
Understanding how these datasets interact is key for project teams. For example, vector data showing trench routes can be overlaid on raster elevation maps to identify grading concerns. Or utility layers can be analyzed in relation to structural footprints to avoid rework. Geodatabases also support version control, making it easier to track changes over time and maintain accurate records for compliance or handoff.
Top Features of GIS Data Structures
- Support for both vector (points, lines, polygons) and raster (imagery, elevation) data
- Centralized geodatabases for project-wide data access and control
- Layer stacking for multi-dimensional site analysis
- Query and filtering tools for isolating relevant project information
Top Benefits for Construction Data Management
- Increases confidence in planning with detailed spatial analysis
- Reduces rework by catching conflicts before they reach the field
- Maintains accurate, organized records for project closeout
- Enables better communication with engineers, surveyors, and inspectors
Best Practices for Managing GIS Data in Construction
- Create templates for standard data layers across all projects
- Work with GIS specialists to validate incoming spatial data
- Regularly update geodatabases with as-built conditions
- Use filtering tools to streamline reviews by discipline or scope
When properly structured, GIS data becomes more than just a map—it becomes the foundation for smarter coordination, planning, and execution across the entire project team.
Top GIS Use Cases in Construction: Site Layouts, Utility Mapping, and Scheduling
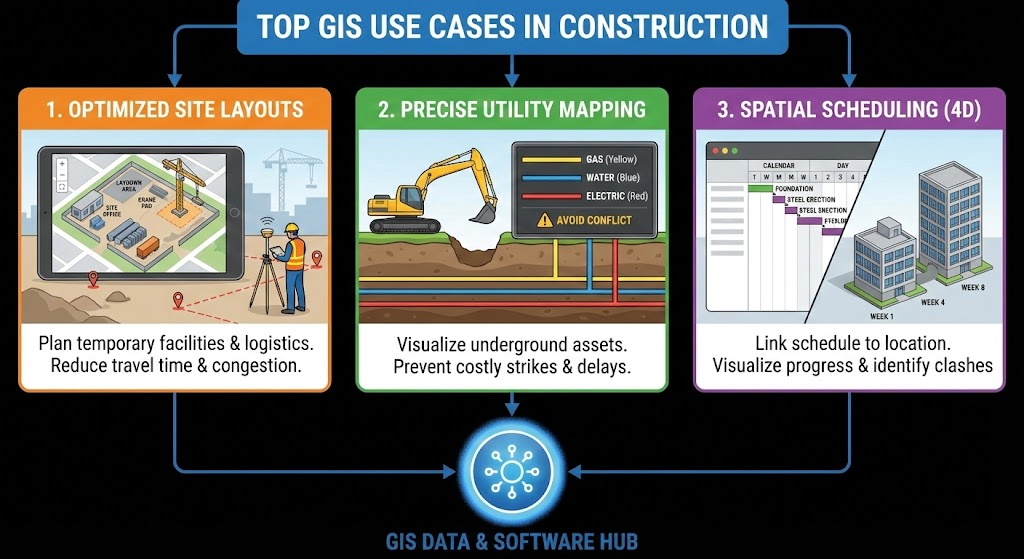
GIS is more than a visualization tool—it’s a powerful engine for solving field-specific problems in real time. From optimizing site layouts to tracking underground utilities and supporting schedule coordination, GIS use cases in construction are expanding rapidly. These tools give general contractors and field leaders new ways to make informed decisions that reduce errors, delays, and rework.
For site layout, GIS helps teams design temporary structures like laydown areas, fencing, crane pads, or parking in relation to existing conditions like slope or setbacks. Utility mapping is one of the most valuable features—contractors can visualize underground infrastructure, overlay new MEP designs, and prevent costly clashes during excavation. GIS also supports scheduling by allowing teams to create spatial timelines, assigning areas of the site to different trades based on time and progress.
One of the most underused but valuable applications is in coordinating inspections and compliance zones. GIS can show inspectors where permits apply, where access is restricted, and what’s been signed off. When field data is layered and updated properly, the jobsite becomes a living map that helps keep everyone in sync.
Top Features Supporting Common Use Cases
- Interactive layout planning with satellite and topographic overlays
- Utility layers showing existing and planned infrastructure
- Timeline-based map views for phased scheduling
- Permit tracking and zoning map integrations
Top Benefits for Everyday Field Coordination
- Prevents utility strikes and spatial conflicts between trades
- Speeds up site setup and reduces staging inefficiencies
- Makes inspections more efficient with mapped compliance zones
- Helps track progress by area for better scheduling alignment
Best Practices for Using GIS in Everyday Operations
- Add GIS markup layers during preconstruction planning
- Map key utilities and access zones before excavation begins
- Review progress spatially during weekly schedule meetings
- Integrate GIS updates with your existing scheduling platform
GIS allows superintendents to shift from static plans to a dynamic, real-time model of the site—unlocking smarter, safer, and more efficient field operations.

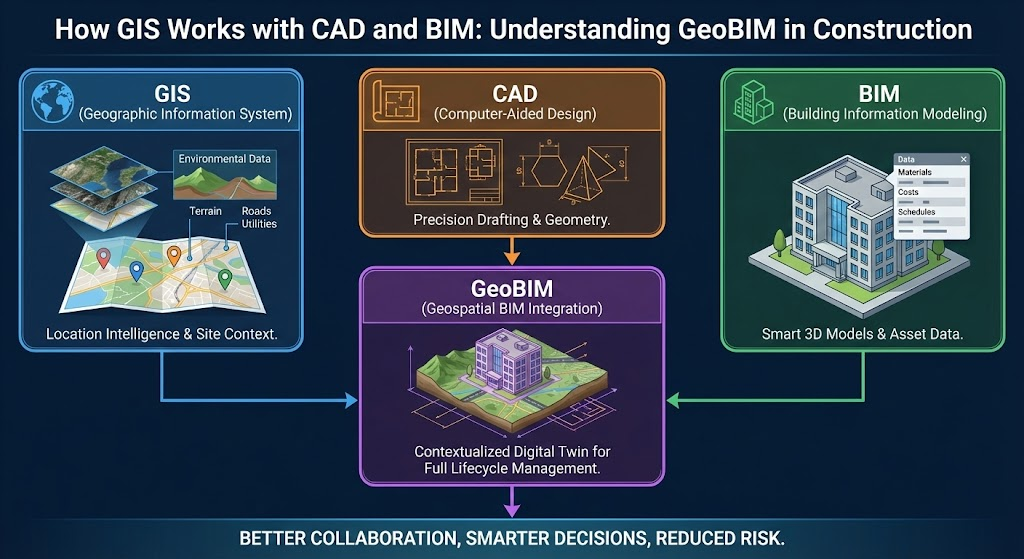
How GIS Works with CAD and BIM: Understanding GeoBIM in Construction
As construction technology continues to evolve, the integration of GIS with CAD and BIM is giving rise to a powerful concept: GeoBIM. GeoBIM is the fusion of geospatial context (GIS) with model-based design (BIM), allowing teams to understand how buildings interact with the real-world environment—before and during construction.
Traditionally, CAD drawings and BIM models have operated in silos, focusing on design and structure. GIS, by contrast, focuses on terrain, land use, zoning, and infrastructure networks. When combined, they allow project teams to plan smarter by answering critical questions: Is the building sited correctly? Will the grading support drainage? Are we at risk of violating utility easements? GeoBIM makes it possible to visualize these elements together in a single interface.
On infrastructure-heavy projects like transportation, data centers, or campuses, the ability to link building models to terrain, roads, utility corridors, and regulatory boundaries is a game changer. It allows for improved collaboration between design teams, engineers, surveyors, and construction crews—all using a shared map-based interface that aligns physical site realities with digital design.
Top Features of GeoBIM Workflows
- Combined viewing of BIM models and GIS map layers
- Accurate geolocation of models within real-world topography
- Interoperability between Revit, Civil 3D, and GIS formats
- Ability to analyze terrain, utilities, and environmental impacts
Top Benefits of CAD + GIS + BIM Integration
- Reduces design-to-field errors caused by missing site context
- Accelerates permitting by showing compliance in geospatial terms
- Enhances planning for utilities, access, and environmental impact
- Improves collaboration between design, field, and review teams
Best Practices for Implementing GeoBIM
- Use shared coordinate systems between GIS and BIM platforms
- Assign project GIS leads to manage spatial data integrity
- Host design coordination sessions within a GeoBIM viewer
- Train field staff to access simplified GeoBIM layers on mobile
GeoBIM isn’t just a design upgrade—it’s a construction management upgrade that helps bridge the digital divide between design intent and field execution.
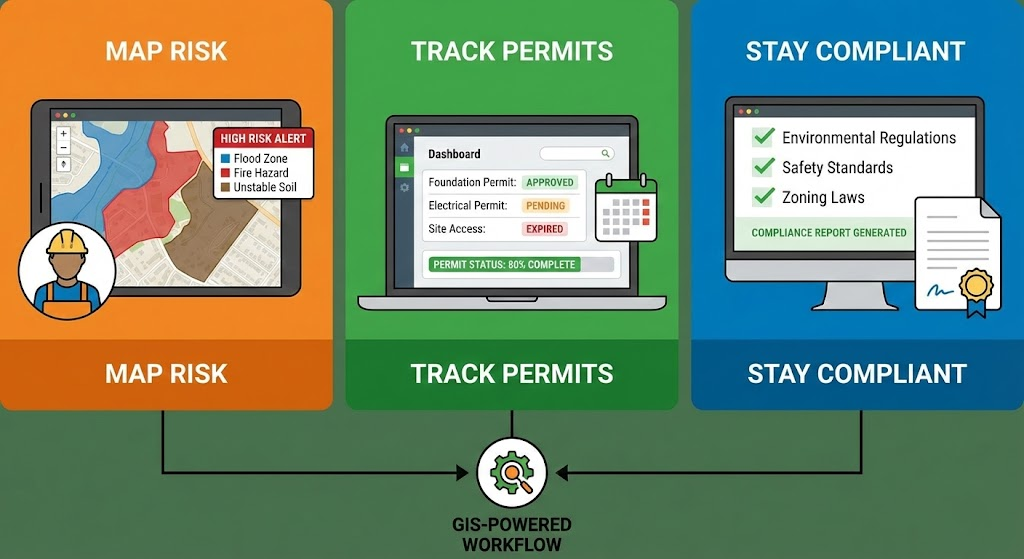
How Contractors Use GIS to Map Risk, Track Permits, and Stay Compliant
Risk management in construction often comes down to two things: knowing what’s underground and staying compliant with what’s above. GIS helps with both. From mapping known hazards and soil conditions to tracking permit zones and environmental buffers, GIS provides a visual layer of risk intelligence that teams can use throughout the project lifecycle.
Contractors use GIS to overlay flood zones, erosion control areas, utility easements, and historical site data. This allows them to flag areas of concern long before breaking ground. For example, GIS can highlight areas with unstable soil, proximity to protected waterways, or areas that require mitigation for endangered species. These insights are critical not only for planning but also for documenting compliance.
Permits are another key area. GIS can link permit data to specific zones on a jobsite. Rather than digging through binders or spreadsheets, superintendents can view a live map showing where work is allowed, where it’s restricted, and what documentation is attached to each area. This makes field inspections and audits far smoother and helps teams respond faster when conditions change.
Top Features Supporting Risk and Compliance
- Layers showing environmental, topographic, and historical site data
- Permit zones with linked documentation and access restrictions
- Hazard flagging for utilities, floodplains, and erosion areas
- GIS dashboards with compliance checklists tied to map locations
Top Benefits for Risk Management and Permitting
- Helps avoid costly compliance violations or shutdowns
- Speeds up inspections with visual permit tracking
- Improves project planning by highlighting hidden risk factors
- Supports more defensible documentation for regulatory review
Best Practices for Using GIS for Risk and Compliance
- Load historical and environmental data into your GIS early
- Create a permitting layer with expiration dates and inspection notes
- Flag high-risk areas with visual markers and attach documentation
- Review compliance zones weekly during progress and safety walks
GIS brings clarity to compliance—transforming static permit paperwork into real-time, map-based insights that help contractors stay ahead of risk.
Benefits of Using GIS Dashboards for Real-Time Jobsite Coordination
On fast-paced construction sites, real-time coordination is essential. GIS dashboards bring together all the spatial and status data that superintendents and project managers need to make informed decisions in the moment. Rather than switching between spreadsheets, email updates, and paper maps, teams can use one centralized, map-based dashboard to view live activity across the jobsite.
A GIS dashboard provides visual indicators for task status, crew location, equipment movement, and delivery tracking—all overlaid on a real site map. Color-coded layers can show completed work, blocked access zones, pending inspections, or safety hazards. With real-time input from the field, the dashboard becomes a living representation of project health that can be used to guide daily huddles, planning sessions, or client walkthroughs.
This visibility also helps coordinate across trades. When one team updates their zone or flags a delay, others see it immediately. Office teams can monitor progress remotely and shift priorities without having to call the site. For large projects with multiple crews, remote stakeholders, or tight sequencing, GIS dashboards are a powerful way to keep everyone aligned without endless back-and-forth.
Top Features of GIS Dashboards in Construction
- Live map overlays showing task status and crew zones
- Color-coded layers for progress, hazards, and site access
- Integration with IoT sensors, weather data, and scheduling tools
- Web-based access for office, field, and client stakeholders
Top Benefits for Daily Jobsite Coordination
- Reduces miscommunication and duplicate work
- Provides one source of truth for all field activity
- Enables faster issue resolution and priority shifting
- Enhances transparency with visual, real-time data
Best Practices for Using GIS Dashboards on Site
- Update dashboard layers at least once per shift
- Use color and symbols to flag progress, safety, and equipment
- Make the dashboard part of your daily huddle routine
- Give field and office teams access with tiered permissions
GIS dashboards let your entire team see the same jobsite—and that shared visibility can be the difference between smooth progress and costly confusion.
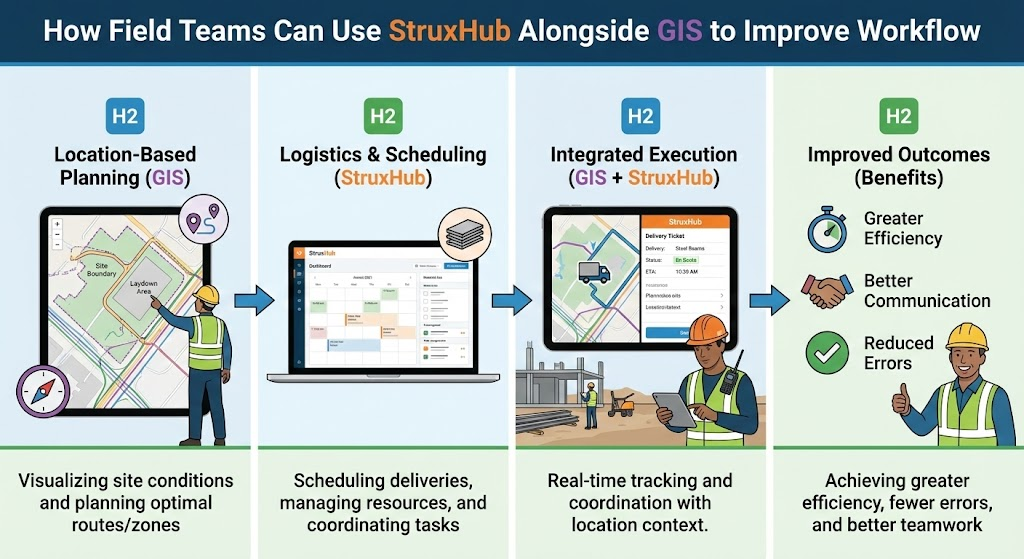
How Field Teams Can Use StruxHub Alongside GIS to Improve Workflow
While GIS provides the spatial context, field teams still need the tools to coordinate tasks, capture updates, and manage documentation. This is where platforms like StruxHub come into play. StruxHub is not a GIS platform—but it’s designed to work alongside one by organizing the workflows that GIS visualizations support.
For example, a superintendent may use a GIS dashboard to view jobsite conditions, then use StruxHub to assign tasks to specific subs, log RFIs, or upload photos. GIS gives you the “where,” and StruxHub handles the “what” and “who.” The two systems work best together when GIS is used to inform decisions, and StruxHub is used to take action and document the results.
Field teams can use StruxHub to record daily progress updates tied to specific locations on a GIS map. Issues flagged in GIS—like blocked access or stormwater overflow—can be translated into actionable tasks, punch list items, or shift notes in StruxHub. Because the platform is built for mobile use, superintendents can toggle between GIS insights and StruxHub workflows without interrupting the rhythm of the job.
Top Features That Complement GIS Tools
- Task assignment, RFIs, and daily logs linked to jobsite zones
- Mobile-ready platform with photo documentation and attachments
- Real-time updates that match GIS-identified site changes
- Centralized hub for communication between field and office
Top Benefits for Field Teams Using Both Platforms
- Converts GIS insights into action items and workflows
- Reduces disconnect between site conditions and coordination tasks
- Keeps documentation and updates organized in one place
- Enables better visibility without doubling up on software
Best Practices for Using GIS and StruxHub Together
- Review GIS maps, then assign related tasks in StruxHub
- Link photos and field notes to specific site conditions
- Use StruxHub daily logs to track updates that GIS maps highlight
- Align both platforms during weekly coordination meetings
When paired together, GIS and StruxHub give teams both the visibility and the structure they need to run a more efficient, responsive construction site.

StruxHub: Revolutionizing Project Management in Large Commercial Construction
How to Choose the Right GIS Tools for Your Construction Projects
Not all GIS tools are created equal—and choosing the right one depends on your project size, field needs, and how your team works. Whether you’re looking for basic map visualizations or complex data integrations with CAD and BIM, it’s critical to evaluate GIS solutions based on usability, data accuracy, and integration potential.
For many contractors, the top priority is ease of use. Field teams need to access GIS maps on mobile devices, toggle data layers, and make quick updates without requiring GIS certification. Look for platforms that offer simplified user interfaces, offline access, and strong support resources. At the same time, your office team will need the ability to import shapefiles, manage geodatabases, and align GIS layers with existing project models.
Another key factor is integration. The best GIS tools integrate with your design software, scheduling systems, and field management platforms. If you’re using Autodesk, Revit, or Civil 3D, choose a GIS solution that supports native file types. If your field teams use StruxHub or other coordination platforms, look for ways to align map data with workflows and reporting.
Finally, consider scalability. A project that starts simple might get more complex later. Choose tools that can grow with your needs without requiring a total system change mid-project.
Top Features to Look For in Construction GIS Tools
- Mobile access with offline support for field users
- Layer toggling, drawing tools, and annotation capabilities
- Compatibility with BIM, CAD, and field software
- Simple admin interface for managing geodatabases
Top Benefits of Choosing the Right GIS Platform
- Reduces ramp-up time and training effort
- Ensures smoother collaboration across teams
- Aligns field insights with office planning and design
- Helps standardize GIS use across multiple projects
Best Practices for Selecting and Onboarding GIS Tools
- Start with a pilot project to test functionality in the field
- Choose tools your team can use daily—not just engineers
- Work with GIS specialists to customize templates and layers
- Make GIS part of your regular project startup process
The best GIS tools are the ones your team will actually use. Keep the focus on usability, integration, and growth to get the most value from your investment.
What to Do Next: Using GIS and Field Software to Streamline Your Projects
If your team isn’t already using GIS tools, now is the time to start. As construction projects grow more complex and fast-paced, spatial awareness is no longer a luxury—it’s a requirement. GIS provides that awareness by linking your data to physical space, helping you reduce errors, improve coordination, and manage jobsite risk with far greater clarity.
The key to success is starting small. You don’t need to overhaul your entire tech stack to get value from GIS. Begin by using maps for site layout and utility visualization, then expand into task coordination, permit tracking, and progress reporting. The goal is to build a foundation of location-based data that supports decision-making across the field and office.
Pairing GIS with your existing field management platform gives you even more power. While GIS shows you the site from a spatial perspective, field tools like StruxHub help you act on that insight—assigning tasks, managing documents, and tracking progress. Together, they form a powerful ecosystem that improves how your teams plan, build, and communicate.
Top Features for Getting Started with GIS
- Map templates with standard construction layers
- Mobile access and annotation tools for field teams
- Easy data imports from CAD or PDF site plans
- Preconfigured dashboards for progress and permit tracking
Top Benefits of Adopting GIS in Construction
- Shortens project timelines by reducing delays and rework
- Improves collaboration between subs, engineers, and GCs
- Enhances safety and compliance with real-time data visibility
- Builds stronger documentation for closeout and audits
Best Practices for Expanding GIS Use
- Start with one use case like site layout or utility tracking
- Standardize GIS layers across projects for consistency
- Train superintendents and PMs on how to use GIS in the field
- Integrate GIS maps into your task and progress workflows
With the right foundation, GIS transforms how you see the jobsite—and how your teams work within it.
How StruxHub Supports GIS-Driven Construction Projects
StruxHub is designed to complement GIS platforms by giving construction teams the coordination tools they need to turn spatial insights into real action. While StruxHub doesn’t provide map layers or GIS modeling, it helps superintendents and project managers organize the tasks, updates, and workflows that GIS brings to light.
When a GIS dashboard reveals an access issue, utility conflict, or staging change, StruxHub helps teams respond immediately—logging issues, assigning follow-ups, or adjusting deliverables in real time. StruxHub serves as the coordination layer that bridges field and office teams, making sure that map-based insights don’t just sit on a screen—they drive progress.
Because StruxHub is mobile-friendly, field teams can toggle between GIS map views and task lists without missing a beat. RFIs, punch items, submittals, and daily logs are all kept in one place and tied to real field conditions. When used alongside GIS, StruxHub brings structure to the site and clarity to communication.
If your team is ready to take GIS from visualization to execution, StruxHub is the tool that gets you there—fast, clean, and field-ready.

StruxHub
Experience the power of StruxHub today and witness firsthand how it can revolutionize your construction operations.
FAQ
What is GIS in construction and why is it important?
A Geographic Information System (GIS) is a mapping technology that links data to physical locations, allowing construction teams to visualize and analyze spatial information. In the context of construction, GIS plays a critical role in everything from early site planning to real-time field coordination. It allows project teams to overlay zoning boundaries, underground utilities, topographic data, and even permit zones directly onto digital maps. This makes it easier to understand the jobsite environment, avoid conflicts, and manage compliance risks.
GIS is especially important in large-scale or infrastructure-heavy projects where crews must coordinate around environmental restrictions, existing infrastructure, or phased development areas. Instead of relying solely on printed site plans, GIS gives superintendents and project managers a dynamic view of how tasks, access routes, safety zones, and work areas change over time.
Another reason GIS is so valuable is that it connects the office and the field. Updates made in the field—like progress, hazards, or layout changes—can be reflected on a GIS dashboard in real time. This improves transparency, reduces miscommunication, and speeds up decision-making.
Ultimately, GIS empowers construction teams to work with greater awareness of their environment. It turns static plans into interactive tools, enabling better collaboration, reduced rework, and stronger project outcomes from preconstruction through closeout.
How do GIS and BIM work together in construction?
GIS and BIM serve different functions in construction, but together they create a more complete view of a project. GIS focuses on geospatial data—the terrain, land use, zoning, infrastructure, and environmental context of the jobsite. BIM, or Building Information Modeling, focuses on the design and construction details of a building or infrastructure asset, including walls, MEP systems, structural elements, and materials.
When GIS and BIM are combined into a GeoBIM workflow, teams can plan and execute projects with both design precision and environmental awareness. For example, a BIM model might show the exact layout of a mechanical room, but GIS reveals that the building sits in a floodplain or near a utility easement. Together, these systems help teams make smarter design choices, minimize risk, and avoid costly delays during construction.
GeoBIM also streamlines communication between disciplines. Designers, engineers, surveyors, and superintendents can work from a shared model that includes both physical site data and detailed building elements. This improves alignment between planning and execution, especially when reviewing access routes, permitting constraints, and underground infrastructure.
With proper integration, GIS and BIM support better site layout, more accurate grading plans, and faster issue resolution. They help contractors visualize how the project interacts with the real world, from the footing to the roof—and everything in between. For modern construction teams, using both is no longer optional. It’s a competitive advantage.
What are the best GIS tools for construction teams?
The best GIS tools for construction teams are those that offer a mix of usability, flexibility, and integration. These platforms should allow both field and office users to access, edit, and share geospatial data easily—without requiring advanced GIS training. They should also work well with your existing systems, such as CAD software, scheduling tools, or field coordination platforms.
For high-end users, ArcGIS by Esri is the industry leader, offering powerful features like map-based dashboards, 3D site modeling, and analytics. For smaller teams or those seeking free and open-source options, QGIS is a flexible tool that supports many standard data formats and offers custom plugin support. Other platforms like Trimble SiteVision, Autodesk InfraWorks, and Google Earth Pro are also commonly used for visualizing site plans and integrating spatial data with design models.
Key features to look for include offline mobile access, annotation tools, data layer toggling, and compatibility with shapefiles or CAD imports. The ability to export or integrate with Revit, Civil 3D, or field software like StruxHub can also significantly enhance usability across the team.
When evaluating GIS tools, don’t just focus on capabilities—consider who will use them. The best solution is the one your superintendents and PMs can pick up and use right away. A powerful GIS tool that goes unused is no better than a paper map.
How do superintendents use GIS in the field?
Superintendents use GIS to gain a clearer, real-time understanding of the jobsite and make better decisions in the field. With a mobile GIS map, they can view everything from underground utilities and permit zones to work areas, access paths, and equipment locations. This spatial awareness reduces confusion, helps coordinate multiple trades, and improves safety across the site.
One of the most common field applications is layout verification. Superintendents can use GIS to ensure materials and crews are staged correctly, access routes are clear, and work zones are properly marked. When plans shift, GIS maps are updated and re-shared instantly—keeping all trades aligned without requiring dozens of phone calls.
GIS is also useful for logging and annotating jobsite changes. A superintendent might mark a blocked access road, flag a hazard, or tag a delivery location directly on the map. This creates a visual record that can be used by project managers, subcontractors, or inspectors to understand current site conditions.
In high-risk or fast-changing environments, GIS gives superintendents a powerful edge. They can respond quickly to changes, visualize upcoming work areas, and communicate clearly with the office—all from a phone or tablet. It’s not just a map. It’s a daily tool that helps run the site smarter.
Can StruxHub work with GIS platforms?
Yes, StruxHub is designed to work alongside GIS platforms by helping construction teams manage the tasks, documents, and coordination workflows that GIS insights generate. While StruxHub doesn’t offer built-in GIS layers or mapping functions, it supports field execution by turning map-based data into trackable tasks, RFIs, daily logs, and punch items.
For example, if a superintendent identifies a conflict on a GIS dashboard—such as overlapping work zones or an inaccessible area—they can immediately log a task in StruxHub, assign it to the appropriate trade, and track the resolution in real time. GIS shows you the “where”; StruxHub helps you manage the “who, what, and when.”
Because StruxHub is mobile-friendly and built for field teams, it works seamlessly alongside GIS applications used on tablets or phones. Crews can toggle between a GIS map view and a StruxHub task list without interrupting their workflow. This ensures that spatial insights lead to real action on the ground—without data getting lost in translation.
Ultimately, the pairing of GIS and StruxHub helps construction teams move from insight to execution faster. Whether you’re managing a high-rise downtown or a multi-acre site, using these platforms together leads to better communication, smoother workflows, and faster project delivery.

StruxHub
Discover how StruxHub can revolutionize your construction management. Contact us today!
StruxHub
Discover how StruxHub can revolutionize your construction management. Contact us today!