Construction Data Analytics: The Power of Visualization and Automated Reporting
Table of Contents:

In the construction industry, the ability to make informed, data-driven decisions can significantly influence project outcomes. As projects become more complex and data-rich, traditional methods of managing information often fall short. This is where data visualization and automated reporting tools come into play, transforming how construction projects are managed and executed.
Data visualization converts complex data into clear, visual formats, making it easier to understand and communicate. Automated reporting, on the other hand, ensures that accurate and timely information is readily available without the need for manual intervention. Together, these tools empower project managers to make better decisions, enhance efficiency, and maintain transparency with stakeholders.
By leveraging these advanced tools, construction teams can gain real-time insights into project performance, identify trends, and address issues proactively. This guide explores the power of data visualization and automated reporting in construction, highlighting how these tools can be used to convert data into actionable insights and streamline reporting processes.
The Power of Data Visualization
Simplifying Complex Information
Data visualization transforms complex datasets into easily understandable visual formats such as charts, graphs, and maps. This simplification helps project managers and stakeholders quickly grasp critical information, facilitating better decision-making. Instead of sifting through pages of spreadsheets and reports, visual tools provide an at-a-glance view of key metrics and trends, making it easier to identify areas that need attention.
By breaking down complex data into digestible visuals, project managers can communicate effectively with their teams and stakeholders. This not only speeds up the decision-making process but also ensures that everyone involved has a clear understanding of the project’s status and any potential issues. Visual tools can highlight patterns and anomalies that might be overlooked in traditional reports, providing deeper insights and more accurate forecasting.
Enhancing Communication
Visual representations of data make it easier to communicate findings and insights to a broader audience. Whether presenting to clients, stakeholders, or team members, visual aids help ensure that everyone understands the project’s status and key issues. Clear, visual communication helps bridge the gap between technical data and practical application, enabling stakeholders to grasp the implications of the data quickly.
For instance, a Gantt chart can show project timelines and dependencies, while a pie chart can break down budget allocations. These visuals can be included in regular reports, presentations, or meetings, making complex information accessible and engaging. Effective data visualization ensures that all parties are on the same page, reducing misunderstandings and enhancing collaborative decision-making.
Identifying Trends and Patterns
Visualization tools allow project managers to identify trends and patterns in the data that might be missed in traditional reports. By visualizing data, you can uncover insights that drive strategic decisions and improve project outcomes. Trends such as increasing costs, resource bottlenecks, or delays in specific tasks can be identified early, allowing for timely interventions.
For example, a line graph showing labor hours over time can reveal periods of low productivity, prompting a review of workforce allocation or working conditions. Similarly, a heat map of resource utilization can highlight areas where equipment is under or overused. Identifying these trends allows project managers to make proactive adjustments, optimizing resource use and enhancing overall project performance.
Related Articles:
Best Guide to Creating a Construction Site Utilization Plan with GIS Mapping, AI, and Logistics Tools

Benefits of Automated Reporting
Efficiency and Accuracy
Automated reporting tools generate and distribute reports at regular intervals, ensuring that data is always up-to-date and accurate. This automation reduces the risk of human error and frees up time for project managers to focus on more critical tasks. Automated systems can pull data from various sources, compile it into a cohesive report, and deliver it to stakeholders with minimal manual intervention.
By automating routine reporting tasks, project managers can ensure consistency and reliability in their data. This not only improves the accuracy of the reports but also increases the speed at which they are produced and disseminated. Automated reporting eliminates the need for manual data entry and consolidation, reducing the likelihood of errors and inconsistencies that can arise from manual processes.
Real-Time Updates
With automated reporting, stakeholders receive real-time updates on the project’s progress. This consistent communication builds trust and keeps everyone aligned with the project’s objectives. Real-time updates mean that any changes or issues can be communicated immediately, allowing for swift action and adjustments.
Real-time reporting tools can be configured to send alerts and notifications whenever significant changes occur. This ensures that project managers and stakeholders are always aware of the latest developments and can respond proactively. By providing timely and accurate information, automated reporting helps maintain transparency and accountability throughout the project lifecycle.
Reducing Administrative Burden
Automated reporting significantly reduces the administrative burden on project managers and their teams. By automating routine tasks, these tools allow teams to allocate their time and resources more effectively, enhancing overall project efficiency. Project managers can spend less time on manual data entry and more time on strategic planning and problem-solving.
Reducing administrative tasks also helps prevent burnout and increases job satisfaction among team members. Automated systems can handle repetitive tasks such as data collection, report generation, and distribution, freeing up valuable time for more meaningful work. This not only improves productivity but also enhances the overall quality of the project management process.
Integrating Data Visualization and Automated Reporting
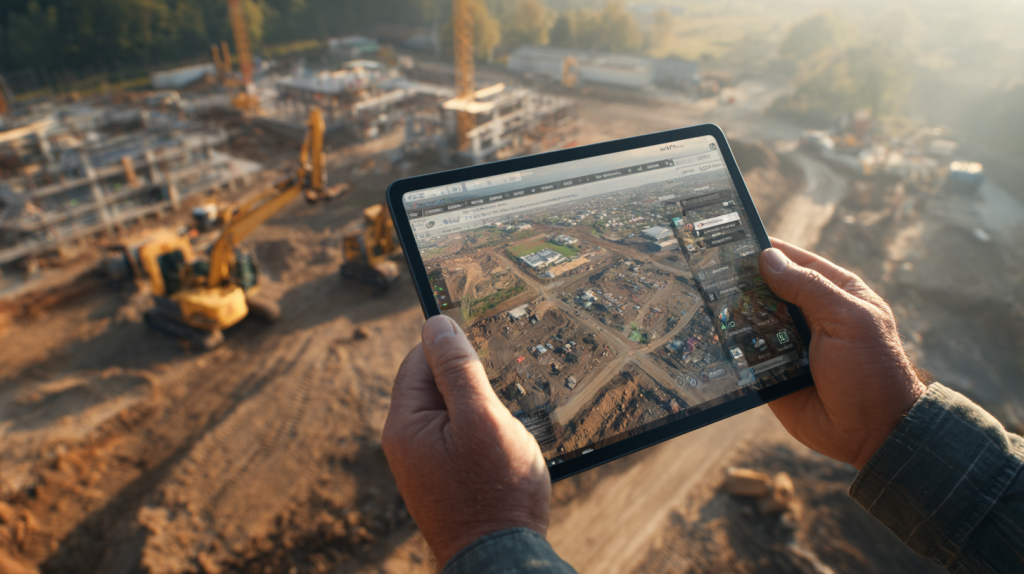
Customizable Dashboards
Customizable dashboards combine the power of data visualization and automated reporting, providing a centralized view of essential project metrics. These dashboards can be tailored to display the most relevant data, ensuring that project managers have the insights they need at their fingertips. Dashboards can include various widgets and visual elements, such as charts, graphs, and tables, to present data in the most effective way.
Customizable dashboards allow project managers to focus on the metrics that matter most to their specific projects. Whether tracking budget expenditures, resource allocation, or project timelines, dashboards provide real-time access to critical information. By consolidating all relevant data into a single, easy-to-use interface, dashboards enhance situational awareness and support better decision-making.
Interactive Reports
Interactive reports allow users to drill down into the data, exploring details that static reports might miss. This interactivity enhances understanding and enables more nuanced analysis, supporting better decision-making. Users can click on different elements within the report to see underlying data, filter information based on various criteria, and customize the report view to suit their needs.
Interactive reports provide a dynamic and engaging way to present data, allowing project managers to explore different scenarios and outcomes. For example, a project manager might use an interactive report to compare actual expenditures against budget forecasts, identify areas of overspending, and develop strategies to mitigate financial risks. This flexibility makes interactive reports a powerful tool for in-depth analysis and strategic planning.
Seamless Integration
Tools like StruxHub offer seamless integration of data visualization and automated reporting, ensuring that all project data is centralized and easily accessible. This integration streamlines workflows and enhances the overall efficiency of project management processes. By consolidating data from various sources into a unified platform, StruxHub enables project managers to gain a comprehensive view of their projects.
Seamless integration also facilitates better data consistency and accuracy, reducing the risk of discrepancies and errors. Integrated systems can automatically update data across different modules, ensuring that all team members have access to the latest information. This holistic approach to data management supports more informed decision-making and improves project outcomes.
Related Articles:
Best Guide to AI in Construction Project Management: How Smart Tools Are Improving Construction Site Productivity; AI
Best Guide to Geographic Information Systems (GIS) in Construction: How Location-Based Data Improves Construction Project Management
Best Guide to Smart Helmets in Construction: Enhancing Safety, Communication, and Site Efficiency
Best Construction Scheduling Software for General Contractors and Superintendents
Best Guide to Solar Farm Construction Management: Top Solar Construction Management Software for Tracking Projects, Deliveries, and Compliance
Real-World Applications
Financial Tracking
Automated reporting and data visualization tools are invaluable for tracking financial performance. By visualizing budget allocations, expenditures, and variances, project managers can ensure that projects stay within budget and make adjustments as needed. Financial dashboards can display key metrics such as cost overruns, savings, and return on investment, providing a clear picture of the project’s financial health.
Real-time financial tracking helps project managers identify potential budget issues early, allowing for timely interventions. For example, a spike in material costs might prompt a review of procurement processes or negotiations with suppliers. By maintaining close oversight of financial metrics, project managers can ensure that projects are completed within budget and deliver the expected value to stakeholders.
Resource Allocation
Effective resource management is critical for project success. Visualization tools can help track resource utilization, identify bottlenecks, and optimize allocation, ensuring that labor, equipment, and materials are used efficiently. Resource dashboards can show the availability and usage of different resources, helping project managers plan and allocate resources more effectively.
By monitoring resource allocation in real-time, project managers can avoid overbooking or underutilizing resources. For example, if a particular piece of equipment is consistently underused, it might be reassigned to a different task or project where it can add more value. Conversely, if a resource is in high demand, additional units might be procured to meet project needs. Effective resource management helps ensure that projects run smoothly and meet their deadlines.
Progress Monitoring
Real-time visualization of project progress helps identify potential delays and keep the project on schedule. Automated reports provide regular updates, ensuring that stakeholders are always informed about the project’s status. Progress dashboards can display metrics such as task completion rates, milestone achievements, and overall project timelines.
By continuously monitoring project progress, project managers can quickly identify any deviations from the plan and take corrective actions. For example, if a critical task is falling behind schedule, additional resources might be allocated to accelerate its completion. Real-time progress monitoring helps keep projects on track, reducing the risk of delays and ensuring timely delivery.
Related Articles:

Top 12 Tips for Leveraging Data Visualization and Automated Reporting
1. Define Clear Objectives
Set clear goals for what you want to achieve with your data visualization and automated reporting tools. This will help you focus on the most relevant data and metrics.
2. Use Customizable Dashboards
Leverage dashboards that can be customized to display the most relevant metrics for your project, ensuring focused and meaningful insights.
3. Regularly Update Metrics
Ensure that your metrics are updated in real-time to reflect the latest data and provide accurate insights.
4. Train Your Team
Invest in training for your team on how to use data visualization tools and interpret automated reports effectively.
5. Maintain Transparency
Share real-time updates with all stakeholders to maintain transparency and build trust.
6. Monitor Resource Utilization
Keep a close eye on how resources are being used to optimize efficiency and reduce waste.
7. Analyze Trends
Regularly review performance data to identify trends and patterns that can inform future project planning.
8. Automate Reporting Processes
Set up automated reporting to ensure timely and accurate dissemination of information without manual effort.
9. Prioritize Key Metrics
Focus on the most critical metrics that impact project success, rather than tracking too many indicators.
10. Encourage Collaboration
Use dashboards and reports to foster collaboration among team members by providing a shared view of project progress.
11. Conduct Regular Reviews
Schedule regular performance reviews to discuss metrics, address issues, and make adjustments as needed.
12. Solicit Feedback
Gather feedback from your team and stakeholders on the reporting tools and metrics used, and make improvements based on their input.
Data-driven decisions are transforming the construction industry, and tools like data visualization and automated reporting are at the forefront of this change. By converting complex data into actionable insights and streamlining reporting processes, these tools enhance project efficiency and transparency. Leveraging tools like StruxHub can help you harness the full potential of your data, ensuring that your projects are managed more effectively and successfully.

StruxHub
Discover how StruxHub can revolutionize your construction management. Contact us today!
StruxHub enhances efficiency and coordination across all project phases, providing a single source of truth that eliminates silos and fosters collaboration. Real-time updates, financial management tools, and seamless communication features ensure that all team members and stakeholders are aligned and informed, reducing the risk of errors and delays. With comprehensive solutions for document management, risk mitigation, and quality control, StruxHub maintains project integrity and safety, while mobile access and integration capabilities further enhance project flexibility and efficiency.
StruxHub’s Key Features and Benefits:
- Advanced Delivery Management: Automate and optimize your delivery schedules, ensuring materials arrive just in time, every time.
- Site Communication: Utilize georeferenced maps and instant messaging to keep every team member informed and aligned.
- Construction Materials Management: Track inventory levels and manage materials procurement with ease, reducing waste and avoiding project delays.
- Construction Safety & Inspection Workflows: Implement customizable mobile forms for conducting safety inspections and managing compliance documentation effortlessly.
- Short-Term Scheduling: Visualize project tasks with detailed floor plans, linking each activity to specific locations for better planning accuracy.
- Construction Resource Management: Efficiently allocate personnel and equipment, maximizing productivity and reducing idle time.
StruxHub’s Product Offering:
- StruxHub Deliveries: Simplifies the coordination of incoming deliveries, ensuring materials and equipment are precisely timed to project needs.
- StruxHub Logistics: Offers intelligent site logistics planning, from crane scheduling to space allocation, for smoother operations.
- StruxHub Safety: Elevates on-site safety standards with easy-to-use tools for inspections, permits, and incident reporting.
- StruxHub Scheduling: Enhances project timelines with intuitive scheduling tools that ensure tasks are completed efficiently and on time.

FAQ
1. How does data visualization benefit construction projects?
Data visualization benefits construction projects by transforming complex data into easily understandable visual formats, such as charts, graphs, and maps. This simplification helps project managers and stakeholders quickly grasp critical information, facilitating better decision-making. Visualization also enhances communication, making it easier to present findings and insights to a broader audience, ensuring everyone understands the project’s status and key issues.
2. What are the advantages of automated reporting in construction management?
Automated reporting offers several advantages in construction management, including increased efficiency, accuracy, and reduced administrative burden. Automated reporting tools generate and distribute reports at regular intervals, ensuring data is always up-to-date and accurate, reducing the risk of human error. They also provide real-time updates, building trust and keeping everyone aligned with the project’s objectives. By automating routine tasks, these tools allow teams to allocate their time and resources more effectively, enhancing overall project efficiency.
3. How can integrating data visualization and automated reporting improve project outcomes?
Integrating data visualization and automated reporting improves project outcomes by providing a centralized view of essential metrics through customizable dashboards. This integration allows for seamless monitoring of project performance, real-time updates, and deeper analysis through interactive reports. Tools like StruxHub offer these features, ensuring that all project data is centralized and easily accessible. This streamlined approach enhances decision-making, optimizes resource allocation, and ensures projects stay on track.
4. Why is real-time data important for construction projects?
Real-time data is crucial for construction projects because it provides the most current information, allowing project managers to make timely and informed decisions. Continuous monitoring through real-time data helps identify trends, predict potential problems, and adjust strategies as needed. It ensures that project managers can stay proactive rather than reactive, addressing issues before they escalate. Real-time data also improves transparency and communication with stakeholders, building trust and facilitating smoother project collaboration.